


Easy pie chart is a jQuery plugin that uses the html5 canvas element to render simple pie charts for single values. These chars are highly customizable and very easy to implement.

Get started
To use the easy pie chart plugin you need to load the current version of jQuery (testet with 1.7.2) and the source (css+js) of the plugin.
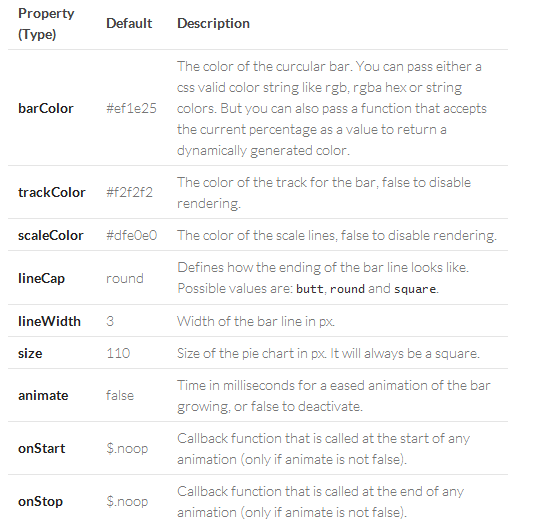
Configuration parameter
You can pass a set of these options to the initialize function to set a custom behaviour and look for the plugin.
 JQuery Carousel Slider Free Download – Owl Carousel 2
[zilla_button url=”https://github.com/rendro/easy-pie-chart” style=”grey” size=”small” type=”round” target=”_blank”] Documentation [/zilla_button] [zilla_button url=”https://github.com/rendro/easy-pie-chart/downloads” style=”grey” size=”small” type=”round” target=”_blank”] Download Now [/zilla_button]